GIS Mapping: An Essential Skill for Environmental Scientists and YOU
Goal: Understand the use of GIS mapping in the Environmental Sciences and practice applying GIS skills in Mass Envirothon activities.
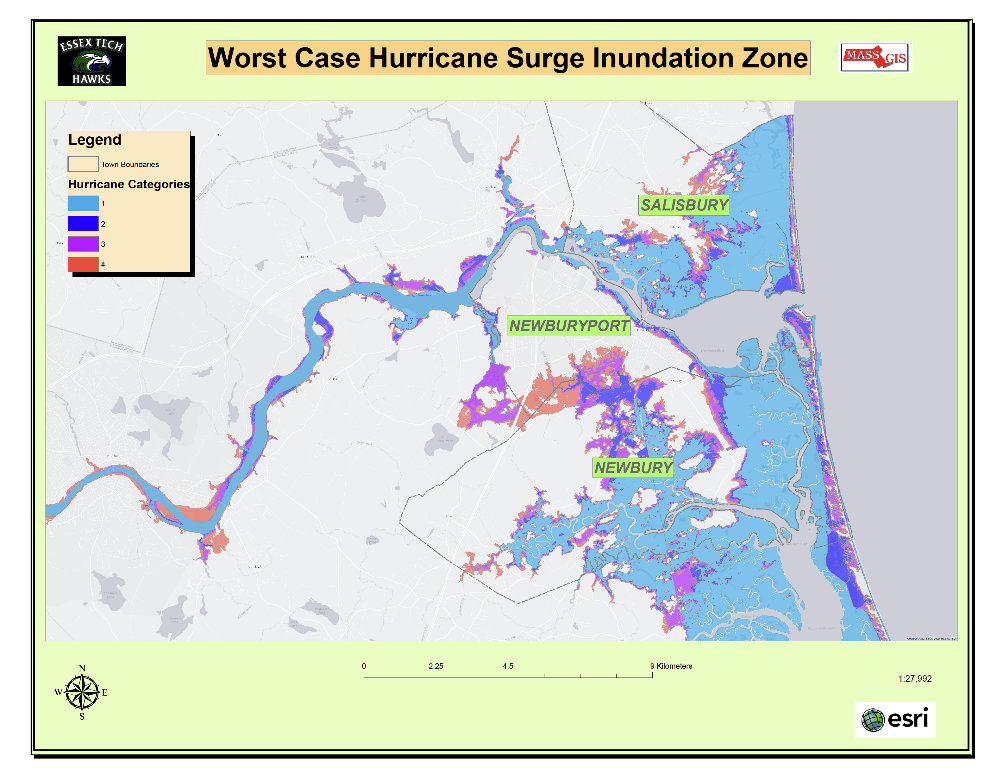
Above Map – An example of a student-created GIS map of the storm surge impacts on some Massachusetts coastal towns. The colors represent worst-case hurricane surge flooding from categories 1, 2, 3, and 4, with blue as category 1 and red as category 4 storm strength.
Learning Objectives: Be able to –
- Define what is GIS mapping software.
- Illustrate why and how Environmental Scientists use GIS mapping.
- Identify how GIS mapping can be useful tool for Mass Envirothon teams.
- Obtain and practice GIS mapping skills to research questions and analyze the resulting data.
Activities:
- Define what is GIS software: GIS (Geographic Information Systems) software is designed to capture, store, manipulate, analyze, manage, and present all types of geographical data. The key word to this technology is Geography – this means that some portion of the data is spatial or represented on the Earth’s surface.
https://www.esri.com/en-us/what-is-gis/overview
- Illustrate why and how Environmental Scientists use GIS:
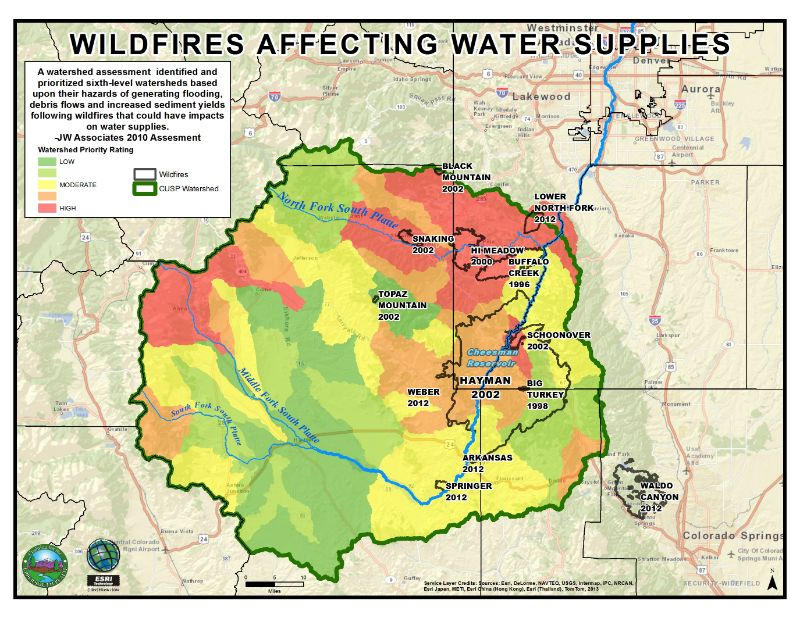
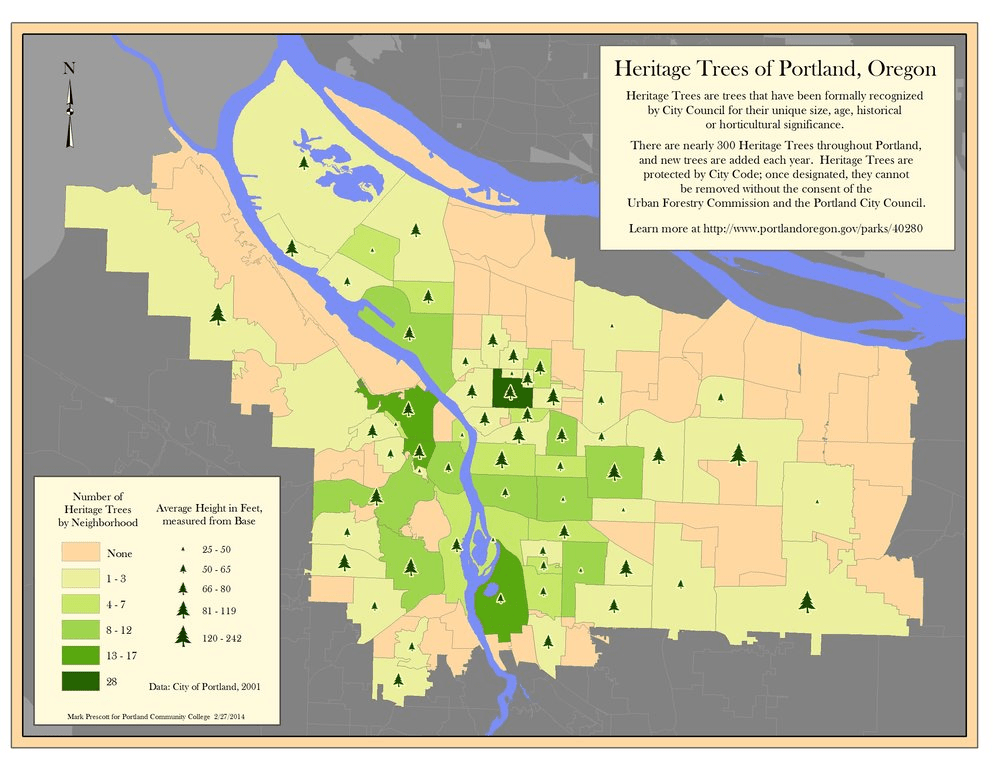
For each map below, what data was necessary to include? How could Environmental Scientists use this type of GIS analysis?


https://www.environmentalscience.org/sustainability-gis
- Identify how GIS can be a useful educational tool for Mass Envirothon teams:
EXAMPLES BELOW –
Participate in the September Challenge:
- EnviroTrek Story map project for all teams: https://arcg.is/0yOvy8
- Farmers Market Survey for all teams: https://arcg.is/09zb8W
Forestry Resources and GIS:
- Identify and map the trees in a local park or on your campus
- Identify and map local trees impacted by invasive insects
- Create a Story Map of pictures and locations of the above
Aquatic Resources and GIS:
- Measure and map stream or lake water quality at different locations, depending on land uses.
- Create a Story Map of pictures and your water quality data illustrating the effects of agriculture, industry, city runoff, wastewater treatment, stormwater, etc. on water quality.
Soil Resources and GIS
- Measure and map soil characteristics (ex. infiltration rate or porosity)
- Use the USDA Web Soil Survey Tools to create a local soils map – https://websoilsurvey.sc.egov.usda.gov/App/HomePage.htm
- Create a Story Map of pictures and your soil data illustrating impacts of different land use types on soil characteristics.
Wildlife Resources and GIS:
- Identify and map suitable wildlife habitats and the species most likely found at each.
- Create a Story Map of pictures and locations of wildlife habitats illustrating differently land use.
- Obtain and practice GIS mapping skills to improve your Envirothon Natural Resources knowledge base and to research your Current Issue project. Here are two extensive resources:
Guide to GIS Mapping: https://learn.arcgis.com/en/educators/
Guide to Story Maps: https://storymaps.arcgis.com/en/ and https://storymaps.arcgis.com/en/resources/
Guide to Creating an Environmental Survey for the field: https://esri.app.box.com/v/survey123-jkerski-activity and http://survey123.arcgis.com
